Introduction
The UK’s CIPD has published its annual reward survey. The CIPD reward survey; http://www.cipd.co.uk/hr-resources/survey-reports/reward-management-2013.aspx
“Our findings show organisations responding to multiple contextual factors in their reward management choices. Economic conditions continue to drive pay decisions for many. In the private sector, market competition and employee value are also key drivers, while in the public sector
more traditional forms of reward management prevail.”
The drivers of reward continue to be to attract talent and reward productive behavior. I would argue that retention is less important that it used to be due to the lose labour market. The survey also looks at employee benefits; these can both support the social culture of a business and provide valuable, cost effective non cash engagement tools.
One key aspect that Charles Cotton, the CIPD Reward and Performance advisor, notes is that the reward profession is not particularly advanced in analyzing information in a way that is useful for the business. Cotton goes on to note that
|
“Few employers are able to calculate the cost of their compensation and benefit programs, let alone be able to express this as a proportion of revenue, profit or economic value added.” |
|
Strong Analytics
Reward and HR professionals have a number of tools to add value to the business case:
- Strong analytics
- Employee segmentation
- Data visualisation
Our colleagues in Finance use KPI’s and key ratios to illustrate financial outcomes and we must do the same in reward. We must understand:
- Key business segments and drivers
- The timeframe – immediate, medium or long term, for the business strategies in those key segments
- Key performers in those segments and responsible for those drivers
This information can drive our reward strategy. By presenting appropriate strong analytics through data visualisation on the basis of appropriate segmentation gives a very powerful tool kit for us to work with and make recommendations to line management.
Asking the right questions
Any good analytical work and modelling starts with asking the right questions. There is no point providing large amounts of statistical data and analysis without have a clear view of the questions we are using the data to answer. This is a big issue with big data. We have the data; but what do we use it to prove or disprove?
Reward interventions must “do” something; be it reduce turnover, encourage managers to align with the interests of shareholders, or produce specific results. Reward professionals must be able to show the outcomes of their products and programs. For example, we must be able to show the relationship between our variable pay spend and the revenue generation, the return on capital employer (RoCE) and other key financial indicators.
Disclosure requirements
The “Say on Pay” requirements in the US and the regulations in the UK require the production of charts showing, for example, growth in relative total shareholder return against executive compensation. We must extent this type of analysis through the organisation to show the stakeholders in the business; be they employees, executives, shareholders and regulators, that our reward program is progressive, does not reward failure and, as far as is possible, is “fair”.
I have argued in other blog posts that we are seeing the erosion of privacy around pay. Within five years we will be reporting, as a minimum, on employees by bands of pay and more likely very detailed pay statistics on every employee in our organisation in the interests of “fairness” and transparency.
Strong Analytics II
There is little excuse for not providing strong analytics with appropriate data visualisation. Microsoft Excel provides some very good analytical and graphing tools and using the PowerPivot addin allows for the analysis of very large data sets and even the development of simple data cubes. That is before we get in to many of the off-the-shelf compensation management tools and packages.
Here is an example of strong analytics presented through visualisation I produced from some sample data:

The use of Microsoft Excel’s conditional formatting provides some intuitive “at a glance” analysis of bonus levels by department. I thought about the type of questions the CEO might want to ask about the data and provided the answers in graphical and colour formats.
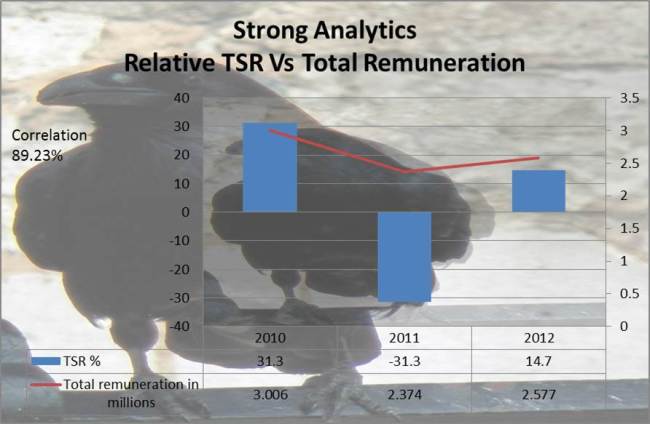
This second example shows a very simple graph of correlation between TSR and total remuneration for a FTSE 100 Executive. It immediately shows the linkage between pay and performance; although TSR needs to be measured over a much longer time period, or alternatively normalised to remove the effects of the economic cycle, to provide a better analytic.

Conclusion
As the CIPD survey noted, reward is, as always, becoming more complicated. At the same time we are seeing far more scrutiny of pay by the largely uninformed politicians, regulators, shareholder advocacy groups and the media. We must arm ourselves for this intrusion by preparing our toolkit of strong analytics to defend our positions and explain our philosophy.

